Visualization & Extraction of Data
One can view or extract all the available data series or the selected data series of the data domain in different formats.
In order to extract and analyse the data of the specific data series , one should first search or filter for the specific type of data series . one can click the “Select all” button to select search/filter result displayed or can click on the checkbox which is found in front of specific data series of the search/filter result.
The selected data series will be shown under the selected data series tab and the user can visualize the selected data series in different formats.
Chart Tab
Once criteria has been specified and Data Series selected from the Available Data Series.You can view the Data in the form of Chart by clicking the Chart tab which is located on the bottom of the page, then a line graph which represents the data points is generated.
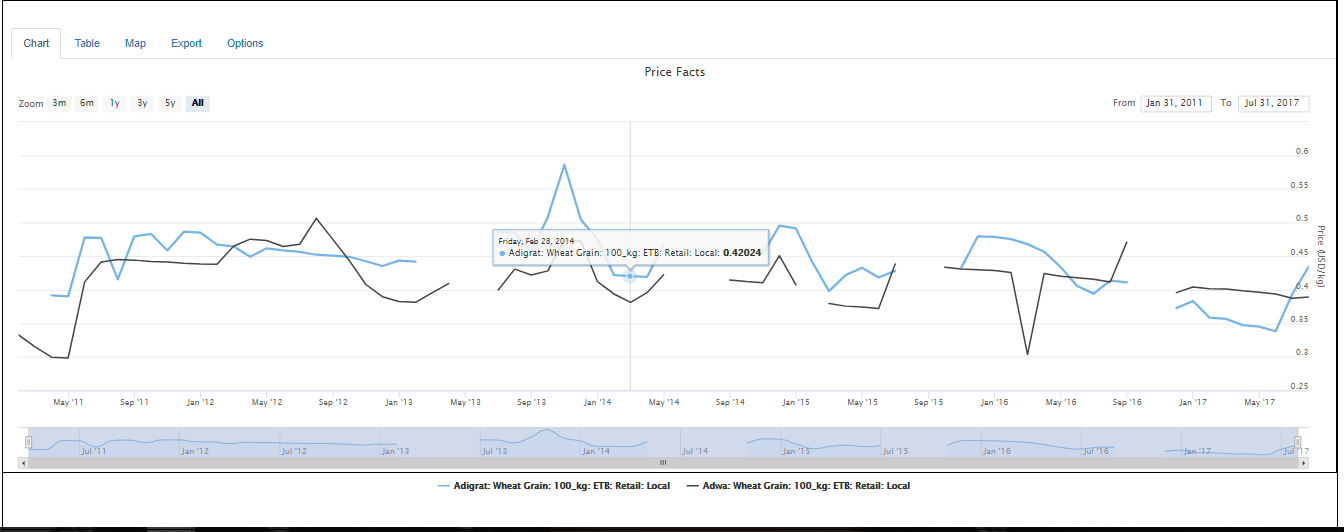 Figure: Chart of the selected data
One can change the time period displayed on the screen by dragging the edges of the window.Hovering over a point in the chart will show the full details of the data points of the selected data series .
Table Tab
In order to view the data points of the selected data series in tabular format, Click the Table tab which is found at the bottom of the page.
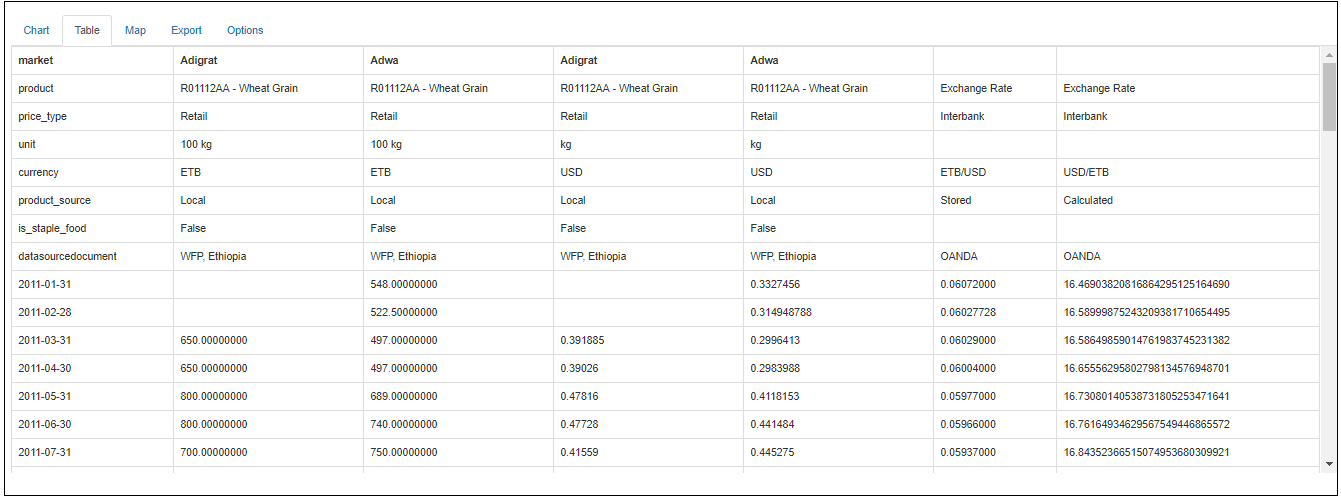
Figure: Selected data in tabular format
Map Tab
The data points of the selected data series can also be represented through map by clicking the Map tab which is found at the bottom of the page.
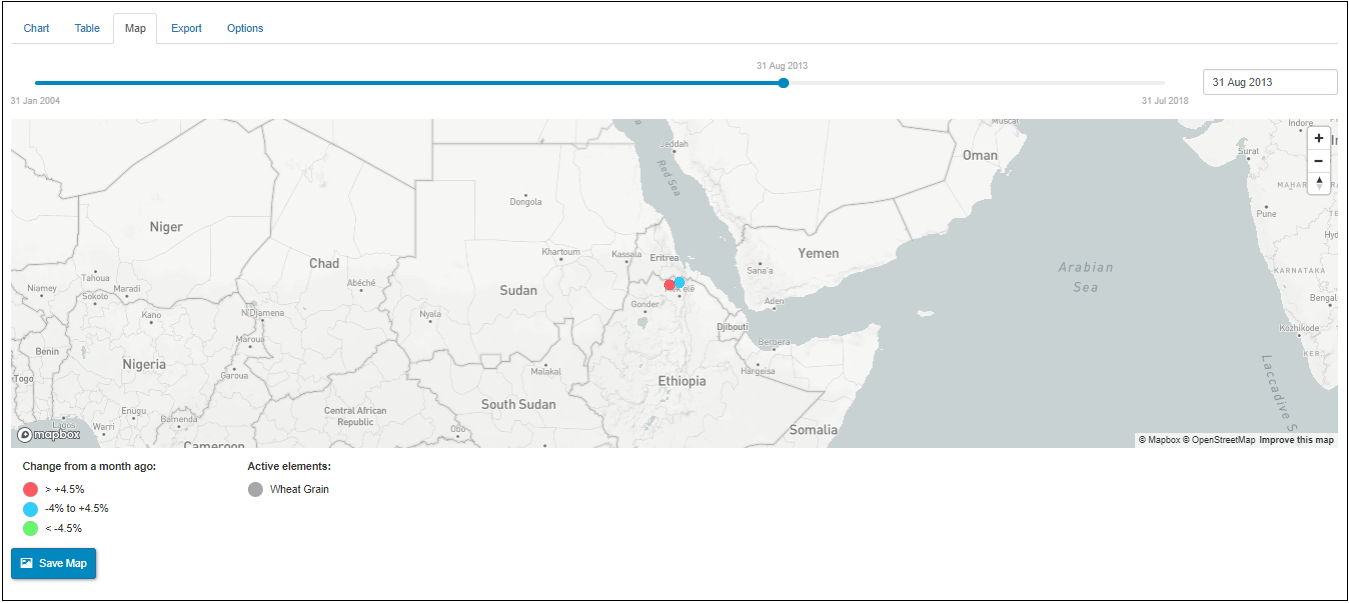
Figure: Map of the selected data
Time slider contains the date range of the data points of the selected data series.It enables the user to visualize the data points of the selected data series by scrolling the slider’s tick back and forth. By clicking the Save map button, one can export the map into PNG format.
Export Tab
To download the data in CSV format ,click the Export tab which is found at the bottom of the page.Click the “Download csv as” drop down button to download the data and then the options Flat & Time series formats will pop up . The user can download the selected data either in Flat or Time series formats by clicking on either of the options ( Flat or Time series formats).
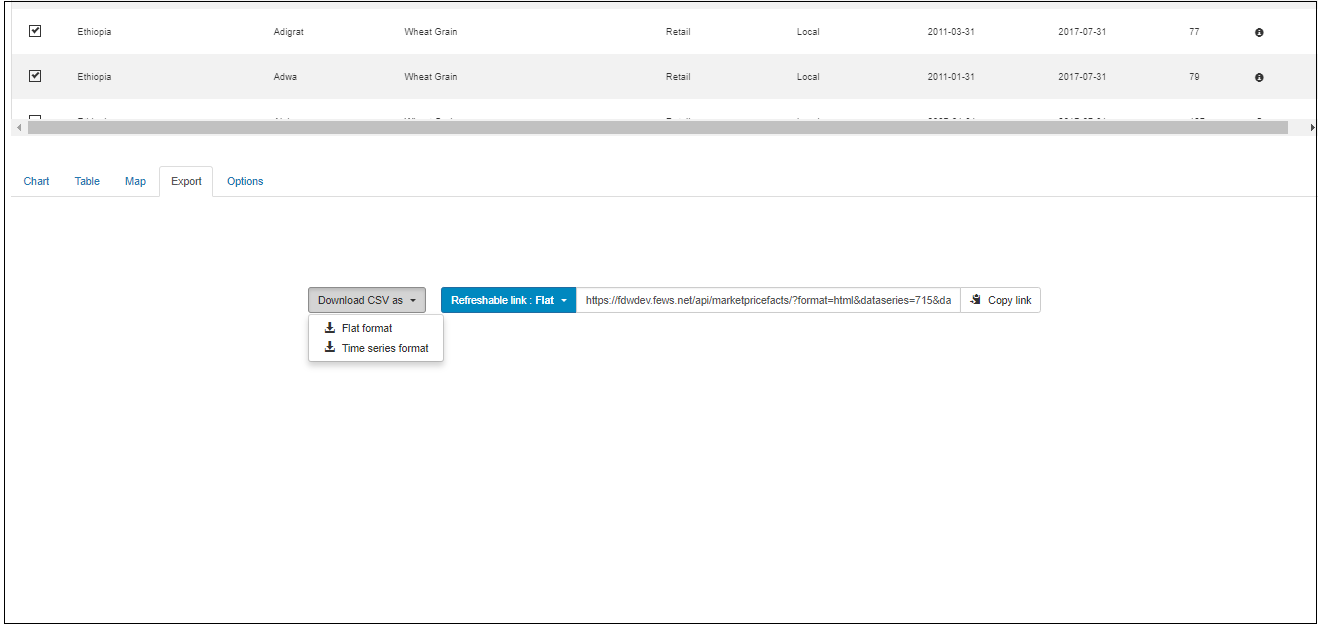
Figure: Export option of the selected data
To download the Refreshable link to either Flat format or Time series format, select the desired format from the button Refreshable link. And click on the Copy link. The system copies the link to the Refreshable link into the your local clipboard and you can past this link to a browser to open the refreshable data.
Options Tab
Options tab is used to aggregate or convert the data in different parameters after one is generating the data of the various data domains.
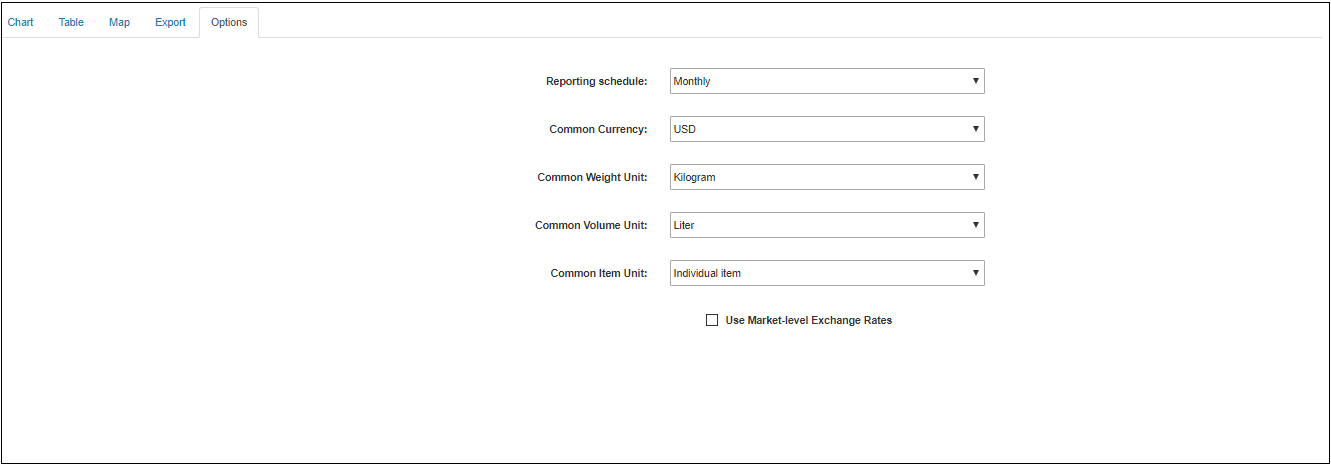
Figure: Data converting & aggregating parameters
One can select any of the parameters included on the options tab and click on either Chart , Table or Map formats and extract the aggregated/converted data based on the submitted criteria of the options tab.