Warehouse
This menu contains crosscutting aspects to all the data that the system is dealing with:
Window: Data Uploads
This functionality enables the user to upload data offline for the different data domains of the system.
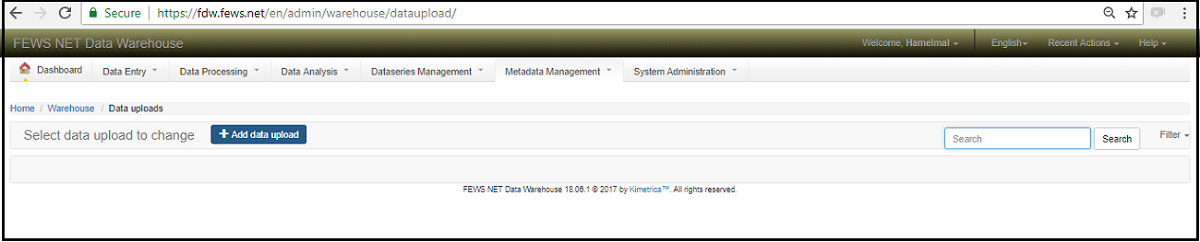
Figure:Data upload screen
In order to upload the data ,Click on Add data upload button and the screenshot below will appear.
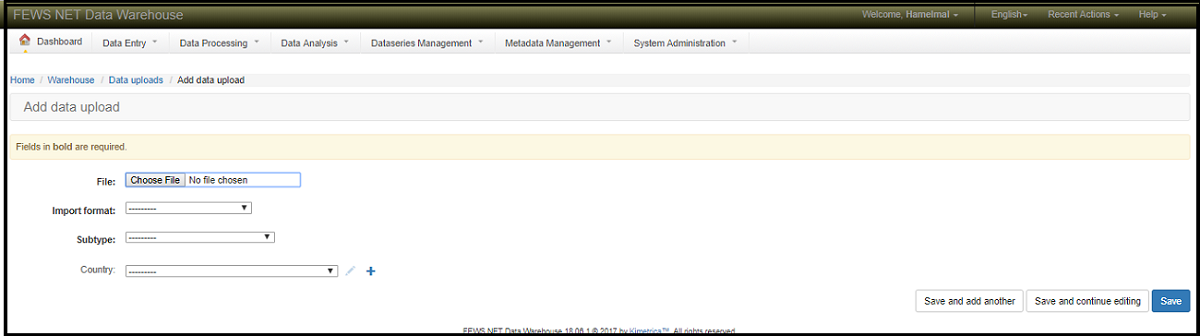
Figure: Data uploading screen
Attach the file that needs to be imported by clicking on Choose File . Next select the Import format (i.e Microsoft excel, comma-separated –values (CSV)…) from the drop down box of Import format. Next , select the Subtype(i.e Market price, Crop production indicator value, Nutrition Indicator value…etc) of the data that is going to be imported and select the Country from the list of the Country drop down box but it is optional. Finally click the Save button.
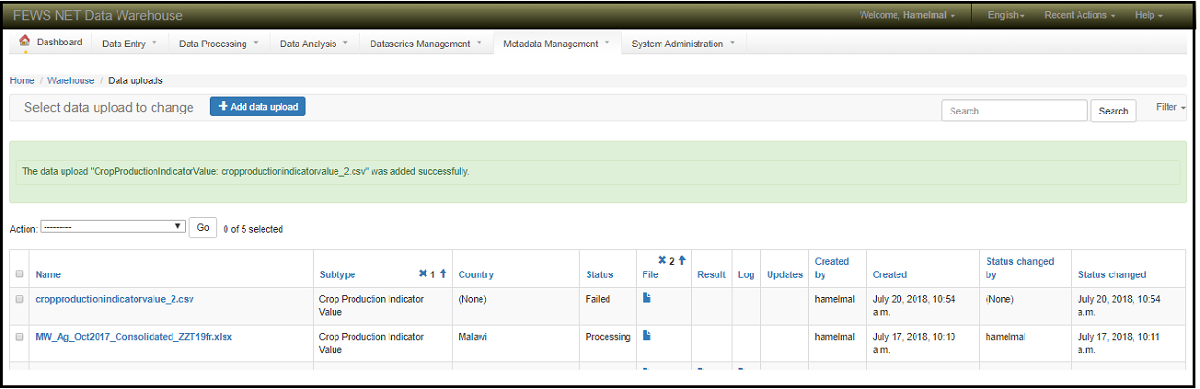
Figure: Uploaded data confirmation screen
When a new file is saved then the status changed to UPLOADED then into PROCESSING status . If the load is successful then the status changed To SUCCEEDED, if not the status is changed to FAILED. The user can also review the log and result files for the Succeeded/failed uploads and the log file also emailed to the person who uploaded the file.
Window: Data usage policies
This feature allows the users to access the data of the system based on the data usage policy they have in the system. Currently there are three types of data usage policies. These are :-
Restricted - The source data will only be visible to users that have been specifically granted permission to use it (or who are Superusers)
Public - The source data may be made available on the public website for analysis by anyone.
KDW Only - The source data may only be analyzed by KDW staff. The results of the analysis may be published.

Figure: Data usage policy screen
Window: Add data usage policy
New data usage policy can be added by clicking the Add data usage policy button from the above screen and the data usage policy adding window will appear. Enter the detail information and click the Save button.

Figure: Data usage policy adding screen
Window: Indicator groups
Window: Add indicator group
Indicator groups will gather individual indicators according to groups. I.e. in Nutrition one group would be Mortality indicators where mortality rate would be separated according to age ranges or gender.
* Abbreviation: The abbreviation will be specified by the Home Office
Name: The name will be given in relation to the abbreviation
Description:
Data Domain: The indicator will be from a Data Domain
Display order:
Window: Indicators
Indicators: Regardless of the group where indicators belong to, Indicators must be first entered individually.
Window: Add indicator
* Abbreviation:
Name:
Indicator group: The drop down list of indicator group will only show groups that have been added in the system.
Display order:
Has confidence interval?: If the indicator has a confidence interval the box must be ticked. And as a consequence when Adding a Survey, the default indicators from the selected Data Domain will appear with the ‘Confidence Interval’ box ticked.
Default indicator: if the Home Office selected this indicator as ‘Default Indicator’, when selecting the relevant Data Domain, this indicator will be included in the list when adding a survey.
Description
Save