Logistic and Supply Chain Model
The objective of the Logistics and Supply Chain Model is to support critical operational and tactical decision-making relating to the supply of essential goods and services, with a focus on emergency distributions and public sector interventions.
The model estimates the probable logistics costs of an intervention with a focus on the distribution of items such as relief food assistance, vaccines or mosquito nets.
The model informs operational and tactical responses for interventions, through the identification of optimal supply chain solutions (network design, routing, storage and distribution planning).
Freight Rate Model
The logistic model estimates the transportation tariff in US dollar per tonne for a given origin and destination.
Input Data
Distance from origin to destination, source OSM maps
Conflict data source ACLED
Distance from the origin to the road network source OSM
Distance from the destination to the road network source OSM
Origin country
Destination country
Digital elevation model
Night time light, source NOAA
Year
Month
Road surface condition
Crude oil price
Data Preprocessing
The script data_pre scrape road network data from OSM. Summary statistics for various routes are extracted from gridded variables. The raster inputs are:
Conflict
Road surface condition
Night time light
Digital elevation model

Figure 1: Correlation matrix
Model
ExtraTreesRegressor model is trained to predict the cost of transportation for a given route. ExtraTreesRegressor is a tree-based ensemble method for regression problems. It essentially consists of randomizing strongly both attribute and cut-point choice while splitting a tree node.
The tasks.py
file takes all of the pre-processed, pre-assembled data to
train ExtraTreesRegressor model. The Train task sets all of the
hyperparameters and trains the model.
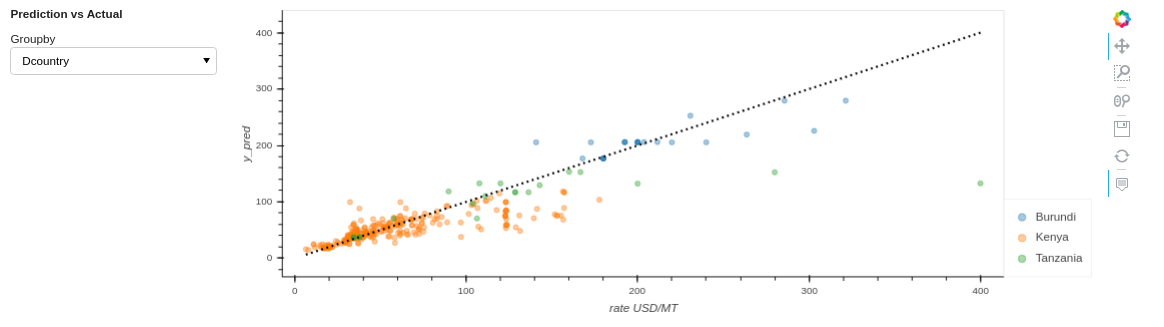
Figure 2: Predicted vs actual freight rate
Model Output
The model outputs a geojson with all the predictors and rate USD/MT.
Example output:
{
"type": "FeatureCollection",
"crs": { "type": "name", "properties": { "name": "urn:ogc:def:crs:OGC:1.3:CRS84" } },
"features": [
{ "type": "Feature", "properties": { "cargo_type": "bagged grain", "Dcountry": "Ethiopia", "Dlatitude": 6.3458333333329513, "Dlongitude": 35.0958333333325, "col": 251, "dest_pop_max": 293.0, "dest_pop_mean": 8.5472837022132797, "dest_pop_median": 2.0, "dest_pop_min": 0.0, "possible_pos": 1, "row": 283, "dest_pop_std": 23.882809912611364, "dest_pop_sum": 4248.0, "Olongitude": 34.587005, "Olatitude": 8.251123, "Ocountry": "Ethiopia", "origin": "Gambela", "origin_pop_max": 6642.0, "origin_pop_mean": 78.361829025844926, "origin_pop_median": 4.0, "origin_pop_min": 0.0, "origin_pop_std": 494.15125570330758, "origin_pop_sum": 39416.0, "distance_calc": 471008.26460398582, "O_dist_t_node": 94.929223651003724, "D_dist_t_node": 9110.8373803348186, "dem_min": 438.0, "dem_max": 2554.0, "dem_mean": 1359.8944091796875, "dem_std": 572.423828125, "dem_median": 1372.0, "night_lights_min": 0.0, "night_lights_max": 2.332709789276123, "night_lights_mean": 0.0011826853733509779, "night_lights_std": 0.021682078018784523, "night_lights_median": 0.0, "acled_min": 0.0, "acled_max": 33.0, "acled_mean": 12.0, "acled_std": 13.583077430725098, "acled_median": 7.5, "surface_condition_good": 0.1505050505050505, "surface_condition_fair": 0.28828282828282831, "surface_condition_bad": 0.0, "surface_condition_excellent": 0.10929292929292929, "surface_condition_poor": 0.38848484848484849, "surface_condition_very_poor": 0.06343434343434344, "month": 1, "year": 2017, "crude_oil_price": 53.59, "border_crossing": 0, "rate USD\/MT": 50.010391624333572 }, "geometry": { "type": "MultiLineString", "coordinates": [ [ [ 34.5878655, 8.2510628 ], [ 34.5878204, 8.2508639 ], [ 34.5877491,
Optimal Points of Service Model
The objective is to minimize the cost walking from population point to Points of Servic (POS) and the cost of transporting cargo from the warehouse to POS.
Model Description
The first term of the objective function is the cost incurred by the beneficiaries to travel to and from the POS. The second term is the freight rate from warehouse to the POS and the third term is the fixed cost of setting up POS.
Sets
\(`I`\): Set of population points, \(`i \in I`\)
\(`J`\): Set of potential point of Service (POS), \(`j \in J`\)
Scalars
\(`r`\): is the coverage radius
Parameters
\(`p_{i}`\): Population residing in population point \(`i \in I`\)
\(`d_{i}`\): Demand of population point \(`i \in I`\). The demand can be fixed or a multiple of \(`p_{i}`\)
\(`l_{ij}`\): Great circle distance between population point \(`i \ in I`\) and potential POS \(`j \in J`\)
\(`\alpha_{ij}`\): Is the cost of walking from population point \(`i \in I`\) to potential POS \(`j \in J`\)
\(`\beta_{j}`\): Freight rate
\(`k_{ij}`\): 1, if \(`l_{ij} \leq r`\) else 0
\(`z_{i}`\): 1, if \(`\sum_{j \in J} k_{ij} \ge 0`\) else 0
\(`\omega_{j}`\): The fixed cost of setting up POS
Decision Variables
\(`x_{ij}`\): Binary variable equals to 1 if and only if population point \(`i \in I`\) is assigned to POS \(`j \in J`\)
\(`y_{j}`\): Binary variable equals to 1 if and only if the potential POS \(`j \in J`\) is optimal
Model
minimize
Constraints
Model Output
The model output a two csv files:
output/final_targets/logistic_model/optimal_pos{hash}.cs. This csv files shows the optimal points of service.output/final_targets/logistic_model/optimal_route{hash}.csv. This csv files shows the optimal route from population point to point of service.
The command for running the model over Oromia with maximum walking distance set to 5 km:
luigi --module models.logistic_model.tasks models.logistic_model.tasks.OPtimalPOSLocation\
 --local-scheduler--time 2017-01-01-2017-02-01 --cargo-type 'bagged grain' \
 --country-level Ethiopia --max-walking-dist 5 --population-percent 1
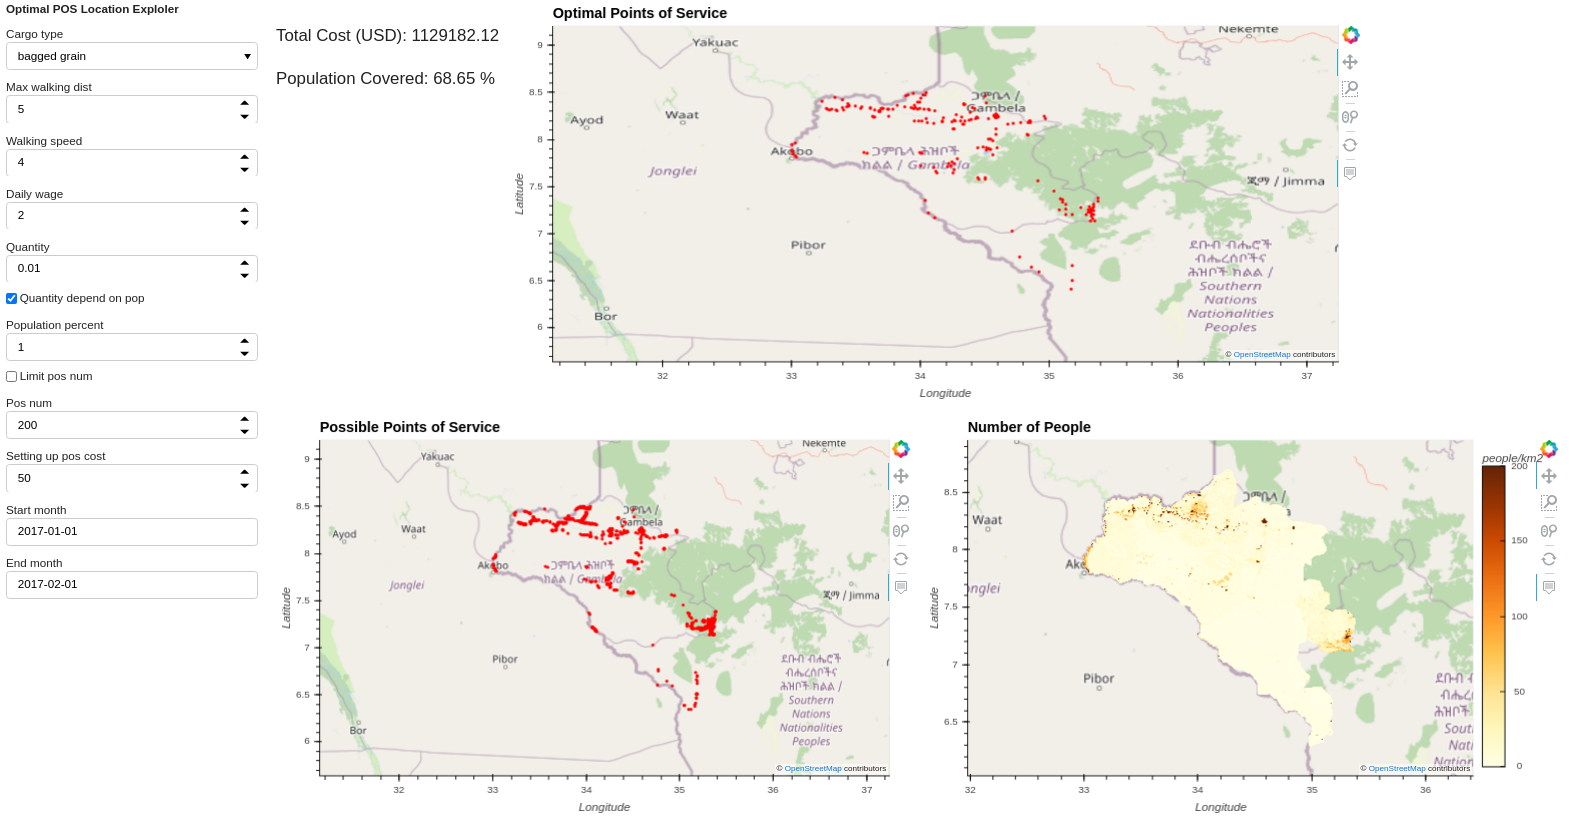
Figure 3: Optimal point of service explorer (max-walking-dist = 5)
The command for running the model over Oromia with maximum walking distance set to 10 km:
luigi --module models.logistic_model.tasks models.logistic_model.tasks.OPtimalPOSLocation\
 --local-scheduler --time 2017-01-01-2017-02-01 --cargo-type 'bagged grain' \
 --country-level Ethiopia --max-walking-dist 10 --population-percent 1
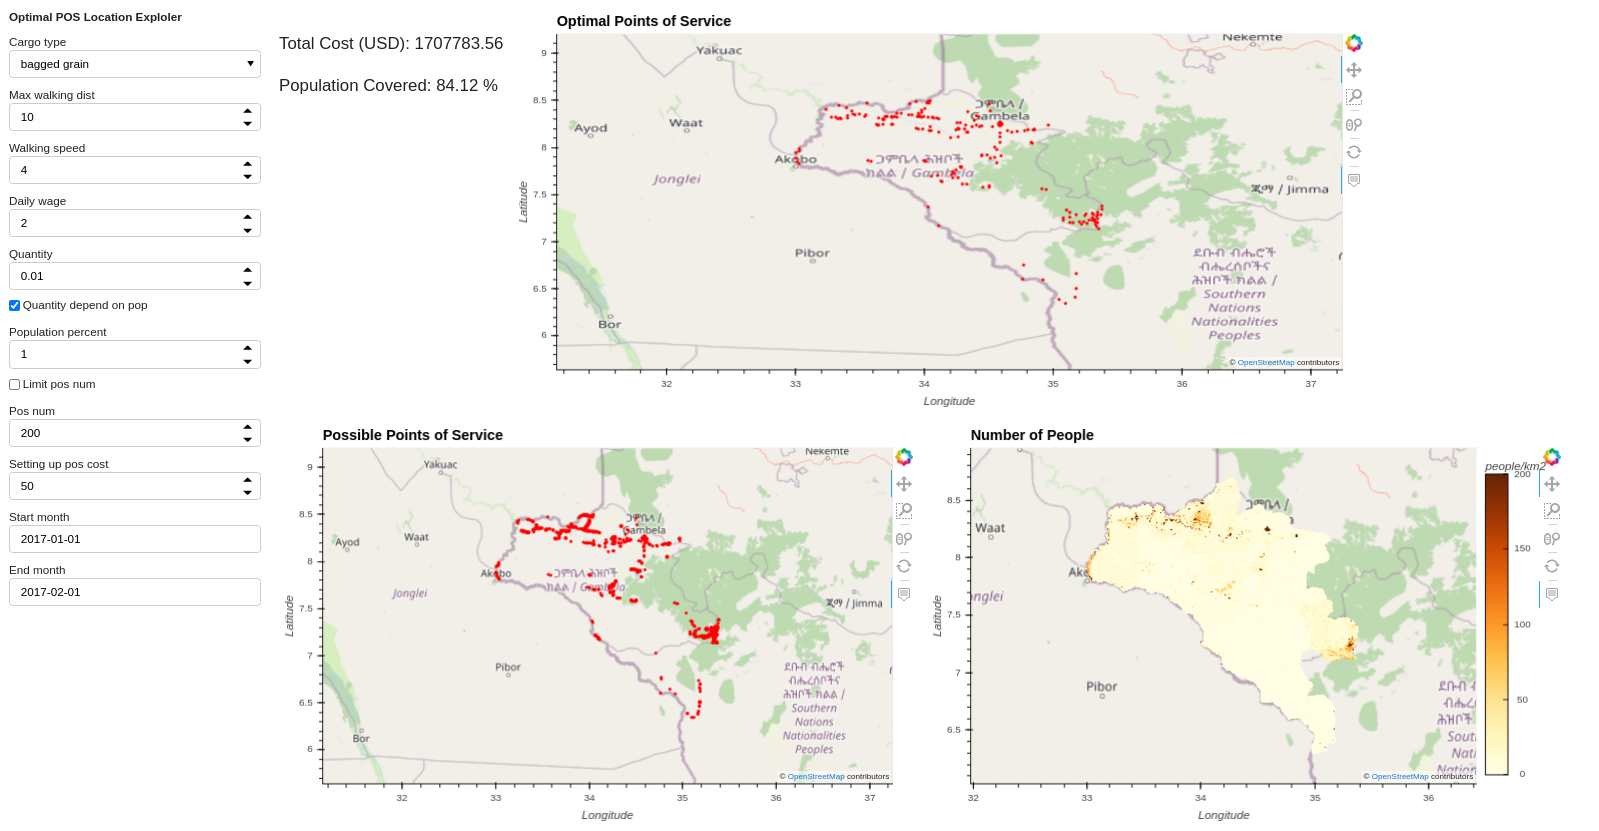
Figure 4: Optimal point of service explorer (max-walking-dist = 10)
Tunable Parameters
name: max_walking_dist:
description: The maximum distance beneficiaries can walk from population point to POS.
metadata:
type: FloatParameter
default: 5.0
name: walking_speed
description: Beneficiaries walking speed.
metadata:
type: FloatParameter
default: 4.0
unit: km/hr
name: daily_wage
description: Beneficiaries daily wage
metadata:
type: FloatParameter
default: 2.0
unit: US dollar per day (8 hours)
name: quantity
description: The demand by the beneficiaries in tonnes.
metadata:
type: FloatParameter
default: 0.01
unit: tonnes
name: quantity_depend_on_pop
description: If the quanity depend of the population. If true the {quantity} is multiplied by the number of beneficiaries.
metadata:
type: BoolParameter
default: False
name: limit_pos_num
description: If to limit the number of point of service
metadata:
type: BoolParameter
default: False
name: pos_num
description: The number of point of service. Only used if {limit_pos_num} is True.
metadata:
type: IntParameter
default: 200
name: use_population_percent
description: If to use percentage of the population data to determine the number of beneficiaries. If False number of beneficiaries equals to population data.
metadata:
type: BoolParameter
default: False
name: population_percent
description: The percenatge of the population that are beneficiaries
metadata:
type: FloatParameter
default: 0.1
name: setting_up_pos_cost
description: The cost of setting up point of service in US dollar
metadata:
Type: FloatParameter
default: 50