Water and Sanitation Model
Access to improved sanitation and source of drinking water is essential in reducing cases of stunting and diarrhea. Other benefits of access to improved sources of water and sanitation are: time saving, school attendance, and reduction in violence and stress. According to WHO, 2.2 billion people lack access to safely managed drinking water services and 4.2 billion people lack safely managed sanitation services.
Water and sanitation data is reported at predefined geographic areas, mostly admin level 2. Heterogeneity within the geographic region is typically hidden from the policy makers. The objective of the water and sanitation model is to predict the percentage of households that have access to unimproved sanitation and source of drinking water at pixel level. Our hypothesis is that areas where people don’t have access to improved sanitation and source of drinking water share spectral traits that make them distinguishable from areas with improved sanitation and source of drinking water when viewed from above.
Input datasets
Target variables
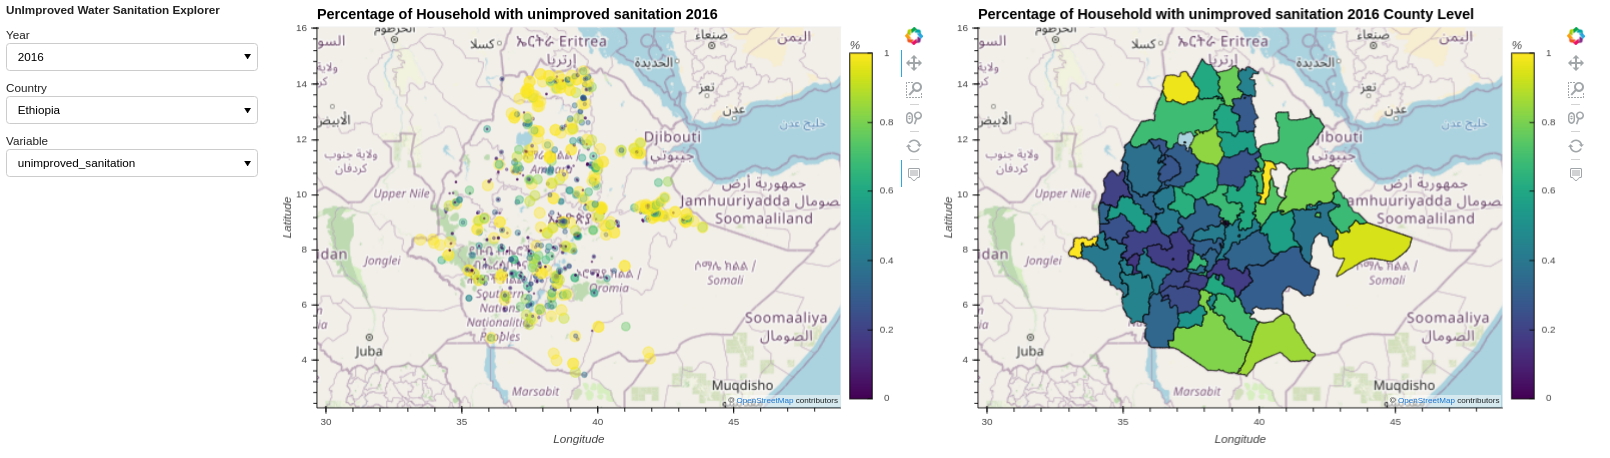
Unimproved sanitation
We used WHO/UNICEF Joint Monitoring Programme for Water Supply, Sanitation and Hygiene (JMP) standards to calculate percentage of households with unimproved sanitation from LSMS survey. JMP defines improved sanitation facilities as those designed to hygienically separate excreta from human contact and not shared with other households. They include: flush/pour flush to piped sewer system/septic tank/pit latrine, ventilated improved pit latrine, and pit latrine with slab.
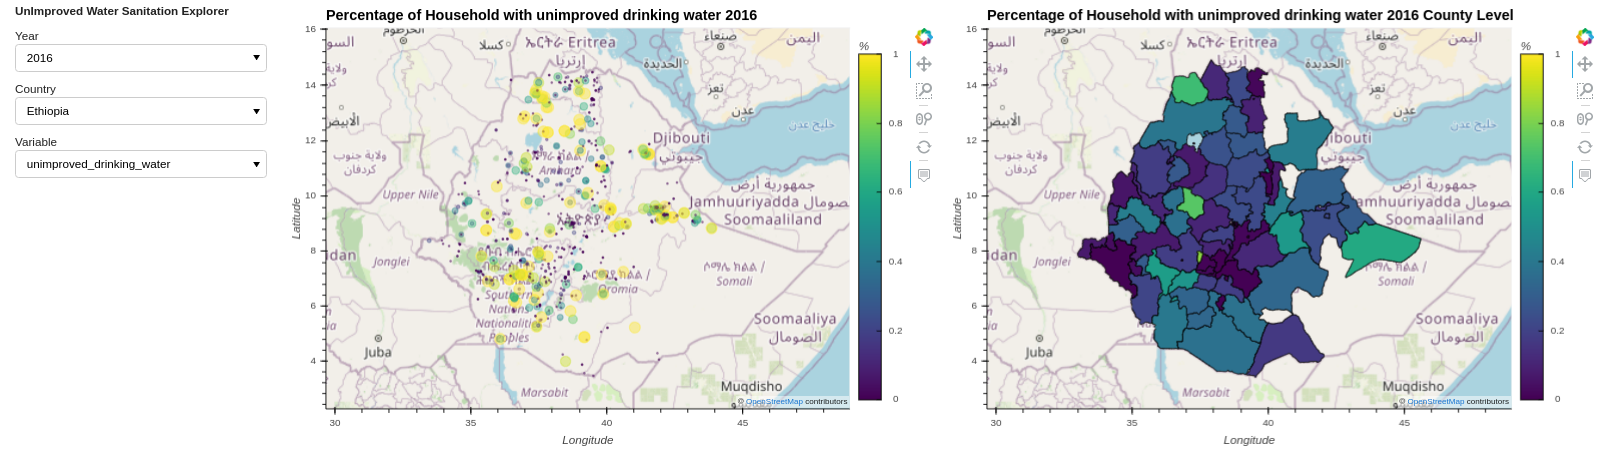
Unimproved source of drinking water
We used JMP standards to calculate the percentage of households with an unimproved source of drinking water. According to JMP, improved drinking water sources are those which, by nature of their design and construction, have the potential to deliver safe water. They include: tap water in the dwelling yard, tap water in public standposts, boreholes/tubewells, protected wells and springs, rainwater, packaged water and delivered water.
Possible predictors
Travel time from Kimetrica’s population model
Population from Kimetrica’s accessibility model
Aridity index
Monthly night time light
Yearly land cover,
Monthly MODIS climate variables
Topographic data.
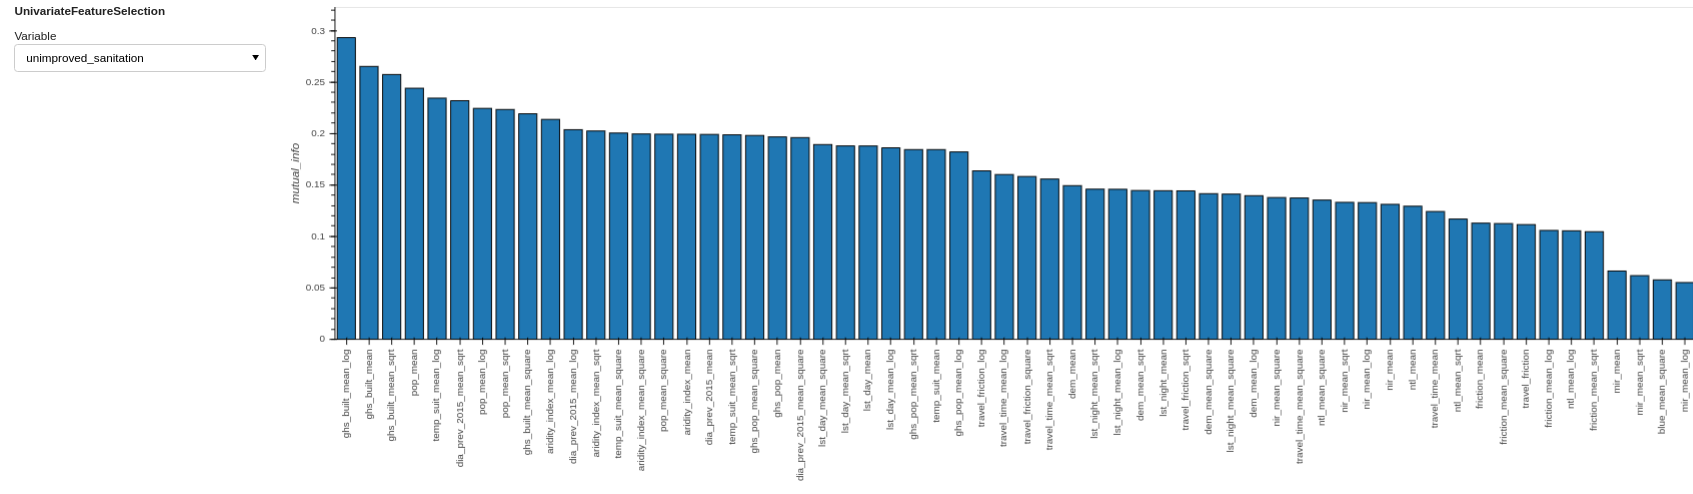
Feature Engineering and Selection
Additional features were created by getting the square, square root and the log of the numeric possible predictors. The original predictors and additional features were compared by estimating mutual information using sklearn between these features and the target. The feature with the highest value was selected.
To select the final predictors, a number of feature selection methods we used. The method used include: lasso regression, random forest, linear regression, and recursive feature elimination with random forest estimator. The methods used outputs coefficient or feature importance which were scaled to be between 0 and 1. After scaling they were aggregated using mean and used to select final predictors.
Building the model
StratifiedShuffleSplit was used to split the data into train and test sets. This method was used to ensure we have the same distribution of target variables in both train and test sets. The estimators that we evaluated are: Random forest regression, Extra tree regressor, linear regression and Histogram-based Gradient Boosting Regression Tree. For each estimator, we created parameters search space and used GridSearchCV to determine the best parameters. The estimators with the best parameters we used to make predictions on the test set. The estimator with highest r-squared was selected as the final model. Histogram-based Gradient Boosting Regression Tree outperformed other estimators with an r-squared of up to 0.7.
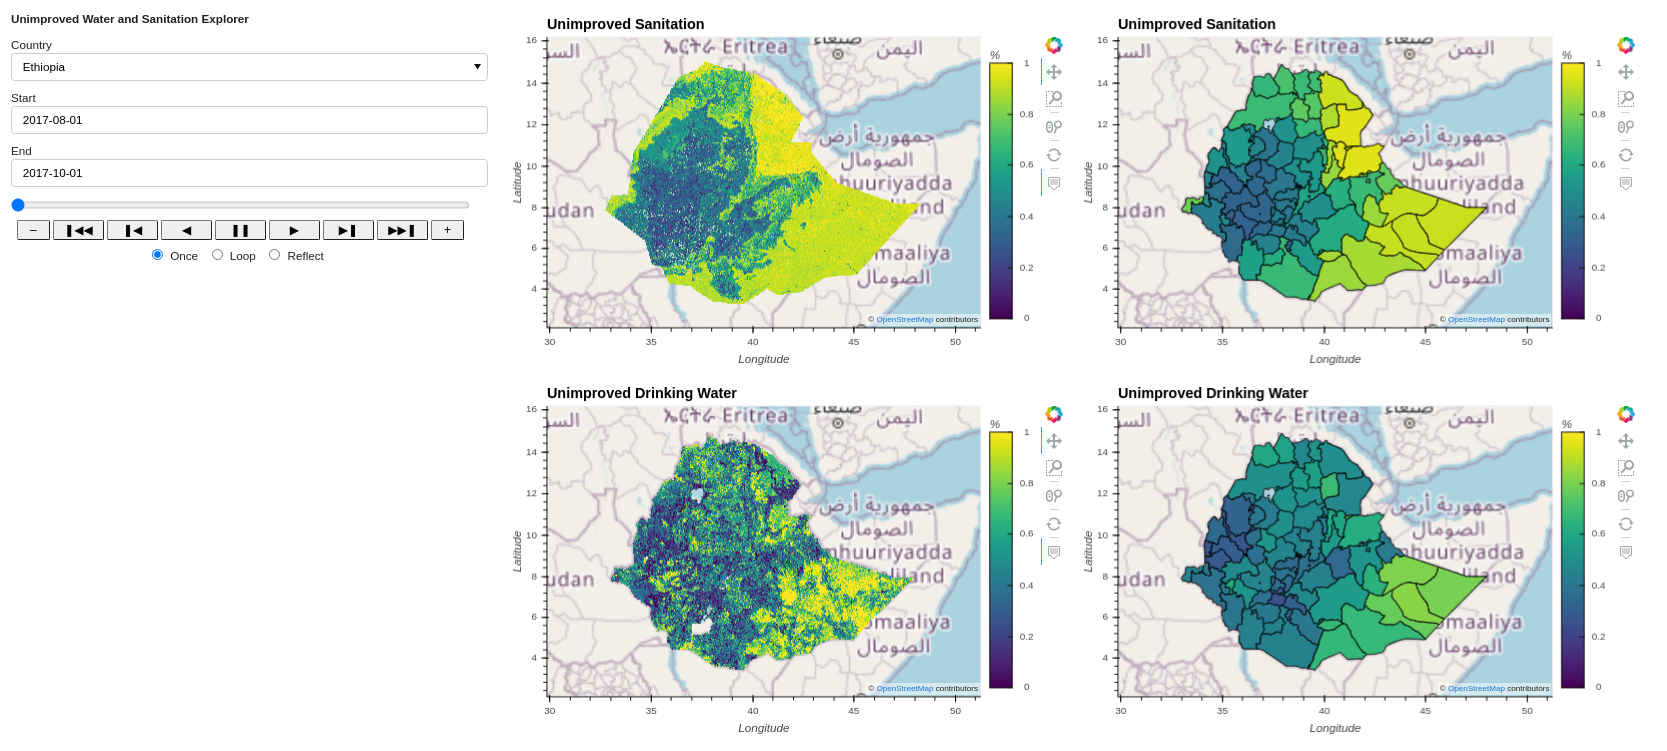
Output of the model
We trained two models that predict proportions of households that have unimproved sanitation and source of drinking water at 1km spatial resolution and month time step.
The command to outputs unimproved sanitation and source of drinking water as netcdf files in Ethiopia:
luigi --module models.water_sanitation_model.tasks models.water_sanitation_model.tasks.PredictUnimprovedSanitation \
--country-level Ethiopia --travel-time-percent-change 0 --aridity-index-percent-change 0 \
--night-light-percent-change 0 --local-scheduler
The command to output unimproved sanitation as netcdf files in Ethiopia:
luigi --module models.water_sanitation_model.tasks models.water_sanitation_model.tasks.PredictUnimprovedToiletFacility \
--country-level Ethiopia --time 2017-08-01-2017-10-01 --aridity-index-percent-change 0 --local-scheduler
The command to output unimproved sanitation as raster files in Ethiopia:
luigi --module models.water_sanitation_model.tasks models.water_sanitation_model.tasks.UnimprovedSanitationRaster \
--country-level Ethiopia --time 2017-08-01-2017-10-01 --aridity-index-percent-change 0 --local-scheduler
The command to output unimproved sanitation as a geojson file in Ethiopia:
luigi --module models.water_sanitation_model.tasks models.water_sanitation_model.tasks.UnimprovedSanitationGeojson \
--country-level Ethiopia --time 2017-08-01-2017-10-01 --aridity-index-percent-change 0 --local-scheduler
The command to output unimproved source of drinking water as netcdf files in Ethiopia:
luigi --module models.water_sanitation_model.tasks models.water_sanitation_model.tasks.PredictUnimprovedDrinkingWater \
--country-level Ethiopia --time 2017-08-01-2017-10-01 --travel-time-percent-change 0 --aridity-index-percent-change 0 \
--night-light-percent-change 0 --local-scheduler
The command to output unimproved source of drinking water as raster files in Ethiopia:
luigi --module models.water_sanitation_model.tasks models.water_sanitation_model.tasks.UnimprovedDrinkingWaterRaster \
--country-level Ethiopia --time 2017-08-01-2017-10-01 --travel-time-percent-change 0 --aridity-index-percent-change 0 \
--night-light-percent-change 0 --local-scheduler
The command to output unimproved source of drinking water as a geojson file in Ethiopia:
luigi --module models.water_sanitation_model.tasks models.water_sanitation_model.tasks.UnimprovedDrinkingWaterGeojson \
--country-level Ethiopia --time 2017-08-01-2017-10-01  --travel-time-percent-change 0 --aridity-index-percent-change 0 \
--night-light-percent-change 0 --local-scheduler